What is information entropy?
It is borrowed from the discipline of physics which is a measure of the disorder among the gas molecules. In Machine learning, this concept has been used by Dr. Shannon in his paper “A Mathematical Theory of Communication” published in 1948. It is called information entropy. In simple terms, it can be understood as the amount of disorder information provides within a given entity.
Why do we use information entropy in AI and how significant is it to social sciences?
As our society evolves from the industrial to its post-industrial phase, automation in industrial production and the need for information handling and retrieval are becoming increasingly important. This trend has pushed pattern recognition to the cutting edge of today’s engineering applications and research. Pattern recognition is an integral part of most machine intelligence systems built for decision making. Amazon’s AI algorithms identifying which products you would prefer, Facebook’s algorithms capacity to identify pictures accurately and segregate them into albums automatically, use information entropy. It is immature to say they use only information entropy; any sophisticated AI algorithm uses multiple approaches.
Before understanding the inevitable interdependence of AI and information entropy, it must be realized that the entire AI algorithms are built on – the measure of statistical significance. Information entropy in ML is a technique to improve the efficacy in understanding the data and recognize the relations between or within the data sets. It is majorly used to classify the data according to the information gain (formulae for the information gain is given below). This classification is done from identifying the correlation between that data sets.
- The lesser the information gain, the more is the correlation among the variables
- The greater the information gain, less is the correlation among the variables
By this phenomenon, the categorization of data will be done using information entropy.
Calculation of Entropy

Entropy: The total uncertainty provided by the information. In the below example, it is the uncertainty of picking the protestors from the whole of the sample of 50 people.
Entropy for a partition: The uncertainty existing in the divided group of data set. In the below example, the uncertainty that we pick the protestor from the group of women or men.
Information Gain: The uncertainty provided by the information when within the data set certain information is known. Understand it as the dataset has been filtered using the existing information.
Explanation by example:
Let’s consider a set of people from Delhi and identify if police picked up any individual from that group would have been a part of CAA protests.
Note: We cannot make an accurate prediction as we cannot quantify all the social attributes of an individual. All we can predict is the probability of an individual being involved in the protests given the conditions assumed is true.
Case 1:
- Let us assume that we have taken a group of 50 people from Shaheen Bagh and our aim is to determine the probability of an individual picked up by police from the group to be involved in the CAA protests.
- Another assumption would be that there are 10 individuals who are involved in the protests. In this example, our aim would be to know the probability of an individual picked from the sample to be involved in the protests.
N (Total number of people in the group) = 50
CP (CAA protestors) =10
NCP (Non – CAA Protestors) =40
P (CP) probability of picking up a protestor = 10/50= 0.2
P (NCP) probability of picking up the non-protestor = 40/50= 0.8
How do we use/understand entropy in this example?
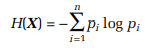
Entropy:
Here, i = CP, NCP
Entropy here is the amount of disorder provided by the the group in finding that an individual picked would be involved in the CAA protests. Pi represents the probability of either individual picked is involved in the protest or not. It can take either values of 0.2 or 0.8.
Entropy: – [1/10{0.46 + 0.46 + 0.46 + ……. + 0.46 (10th time)} + 1/40{0.26 + 0.26 + 0.26 + …… + 0.26 (40th time)}]
= 0.46+0.26
= 0.72
Greater the entropy, more difficult to accurately pick up the protestor and vice versa.
Case 2:
- Let us assume that we have taken a group of 50 people from Shaheen Bagh and our aim is to determine the probability of an individual within the sample to be involved in the CAA protests.
- Another assumption would be that there are definitely 10 individuals who are involved in the protests. In this example, our aim would be to know the probability of an individual picked from the sample to be involved in the protests.
- In this case we shall include gender into the picture and say out of the sample of 50, 20 are women. Out of 10 protesters, 6 are women.
Probability calculations:
N (Total number of people in the group) = 50
CP (CAA protestors) =10
NCP (Non – CAA Protestors) =40
P (CP) probability of picking up a protestor = 10/50= 0.2
P (NCP) probability of picking up the non-protestor = 40/50= 0.8
Along with this, the information is given that among the protestors 6 are women and 4 are men. And, the total number of women and men are given. Now, we can divide the entire group into men and women.


(Women) (Men)
We can calculate entropy separately for each of the group
Here we calculate entropy for partition:
Entropy for the Women box:
= 6/20 log (6/20) + 14/20 log (14/20)
= 0.3 x 1.74 + 0.7 x 0.51
= 0.879
Entropy for the Men box:
= 4/30 log (4/30) + 26/30 log (26/30)
= 0.13 x 2.94 + 0.866 x 0.207
= 0.559
Combined Entropy is calculated by the average of the desired events. Here the desired event is the picking up of the protestor. In the women box, the probability of picking a protestor would be 0.3 and from the Men box, the probability of picking up a protestor would be 0.13.
Combined Entropy:
= 0.3 (0.879) + 0.13 (0.559)
= 0.264 + 0.07267
= 0.34
Information gain = total entropy – Combined Entropy
= 0.72 – 0.34
= 0.38
That means, if there is an information that the person, we are looking is women, then it would become easier to pick the protestor. This is one simple use case of the information entropy. Well, this concept is not used in such mundane statistical calculations, but it is useful when you have unknown variables and millions of data. May be this concept would be used in identifying the areas from which protestors would be coming from and have a vigil on that area whenever a controversial policy would be released.
References:
- https://towardsdatascience.com/how-the-amazon-go-store-works-a-deep-dive-3fde9d9939e9
- https://medium.com/swlh/shannon-entropy-in-the-context-of-machine-learning-and-ai-24aee2709e32
- https://www.youtube.com/watch?v=IPkRVpXtbdY
- https://datascienceathome.com/episode-61-the-4-best-use-cases-of-entropy-in-machine-learning/
